

Short answer: Measure AI adoption by the work people hand over, not by logins or seats. Track eight numbers once a month: active askers, repeat askers, channels in use, jobs handed over, output used as-is, clean-run rate, approval rate and owner coverage. A small team can count all eight by hand from records it already has.
Most published AI adoption metrics assume an enterprise with a telemetry vendor. This scorecard is for a team of 5 to 200 with one person willing to count, and it picks up where the AI coworker onboarding checklist stops: the first job runs, and you need to know whether the habit is spreading.
Why do seat and login counts mislead?
Seat and login counts measure access, the cheap part of adoption. Gallup’s Q2 2026 survey found 52% of US workers use AI in their role, but only 30% use it a few times a week or more, and 15% daily (Gallup, 2026). Depth is thinner still: in a June 2026 survey of 5,026 US knowledge workers, 73.5% used AI only for basic, one-off tasks (Section, 2026). Neither figure shows whether recurring work has moved.
Availability fooled us too. On our CS team, a dashboard that already covered much of what leadership later asked for had been built and demoed, and nobody used it. Some skills we’d described as shipped never reached the set the team had installed; two were rejected on upload for descriptions a few characters over the limit. Shipped is not installed, and installed is not used. Drop seats, message counts and self-reported hours saved; the ladder below shows what to count instead.
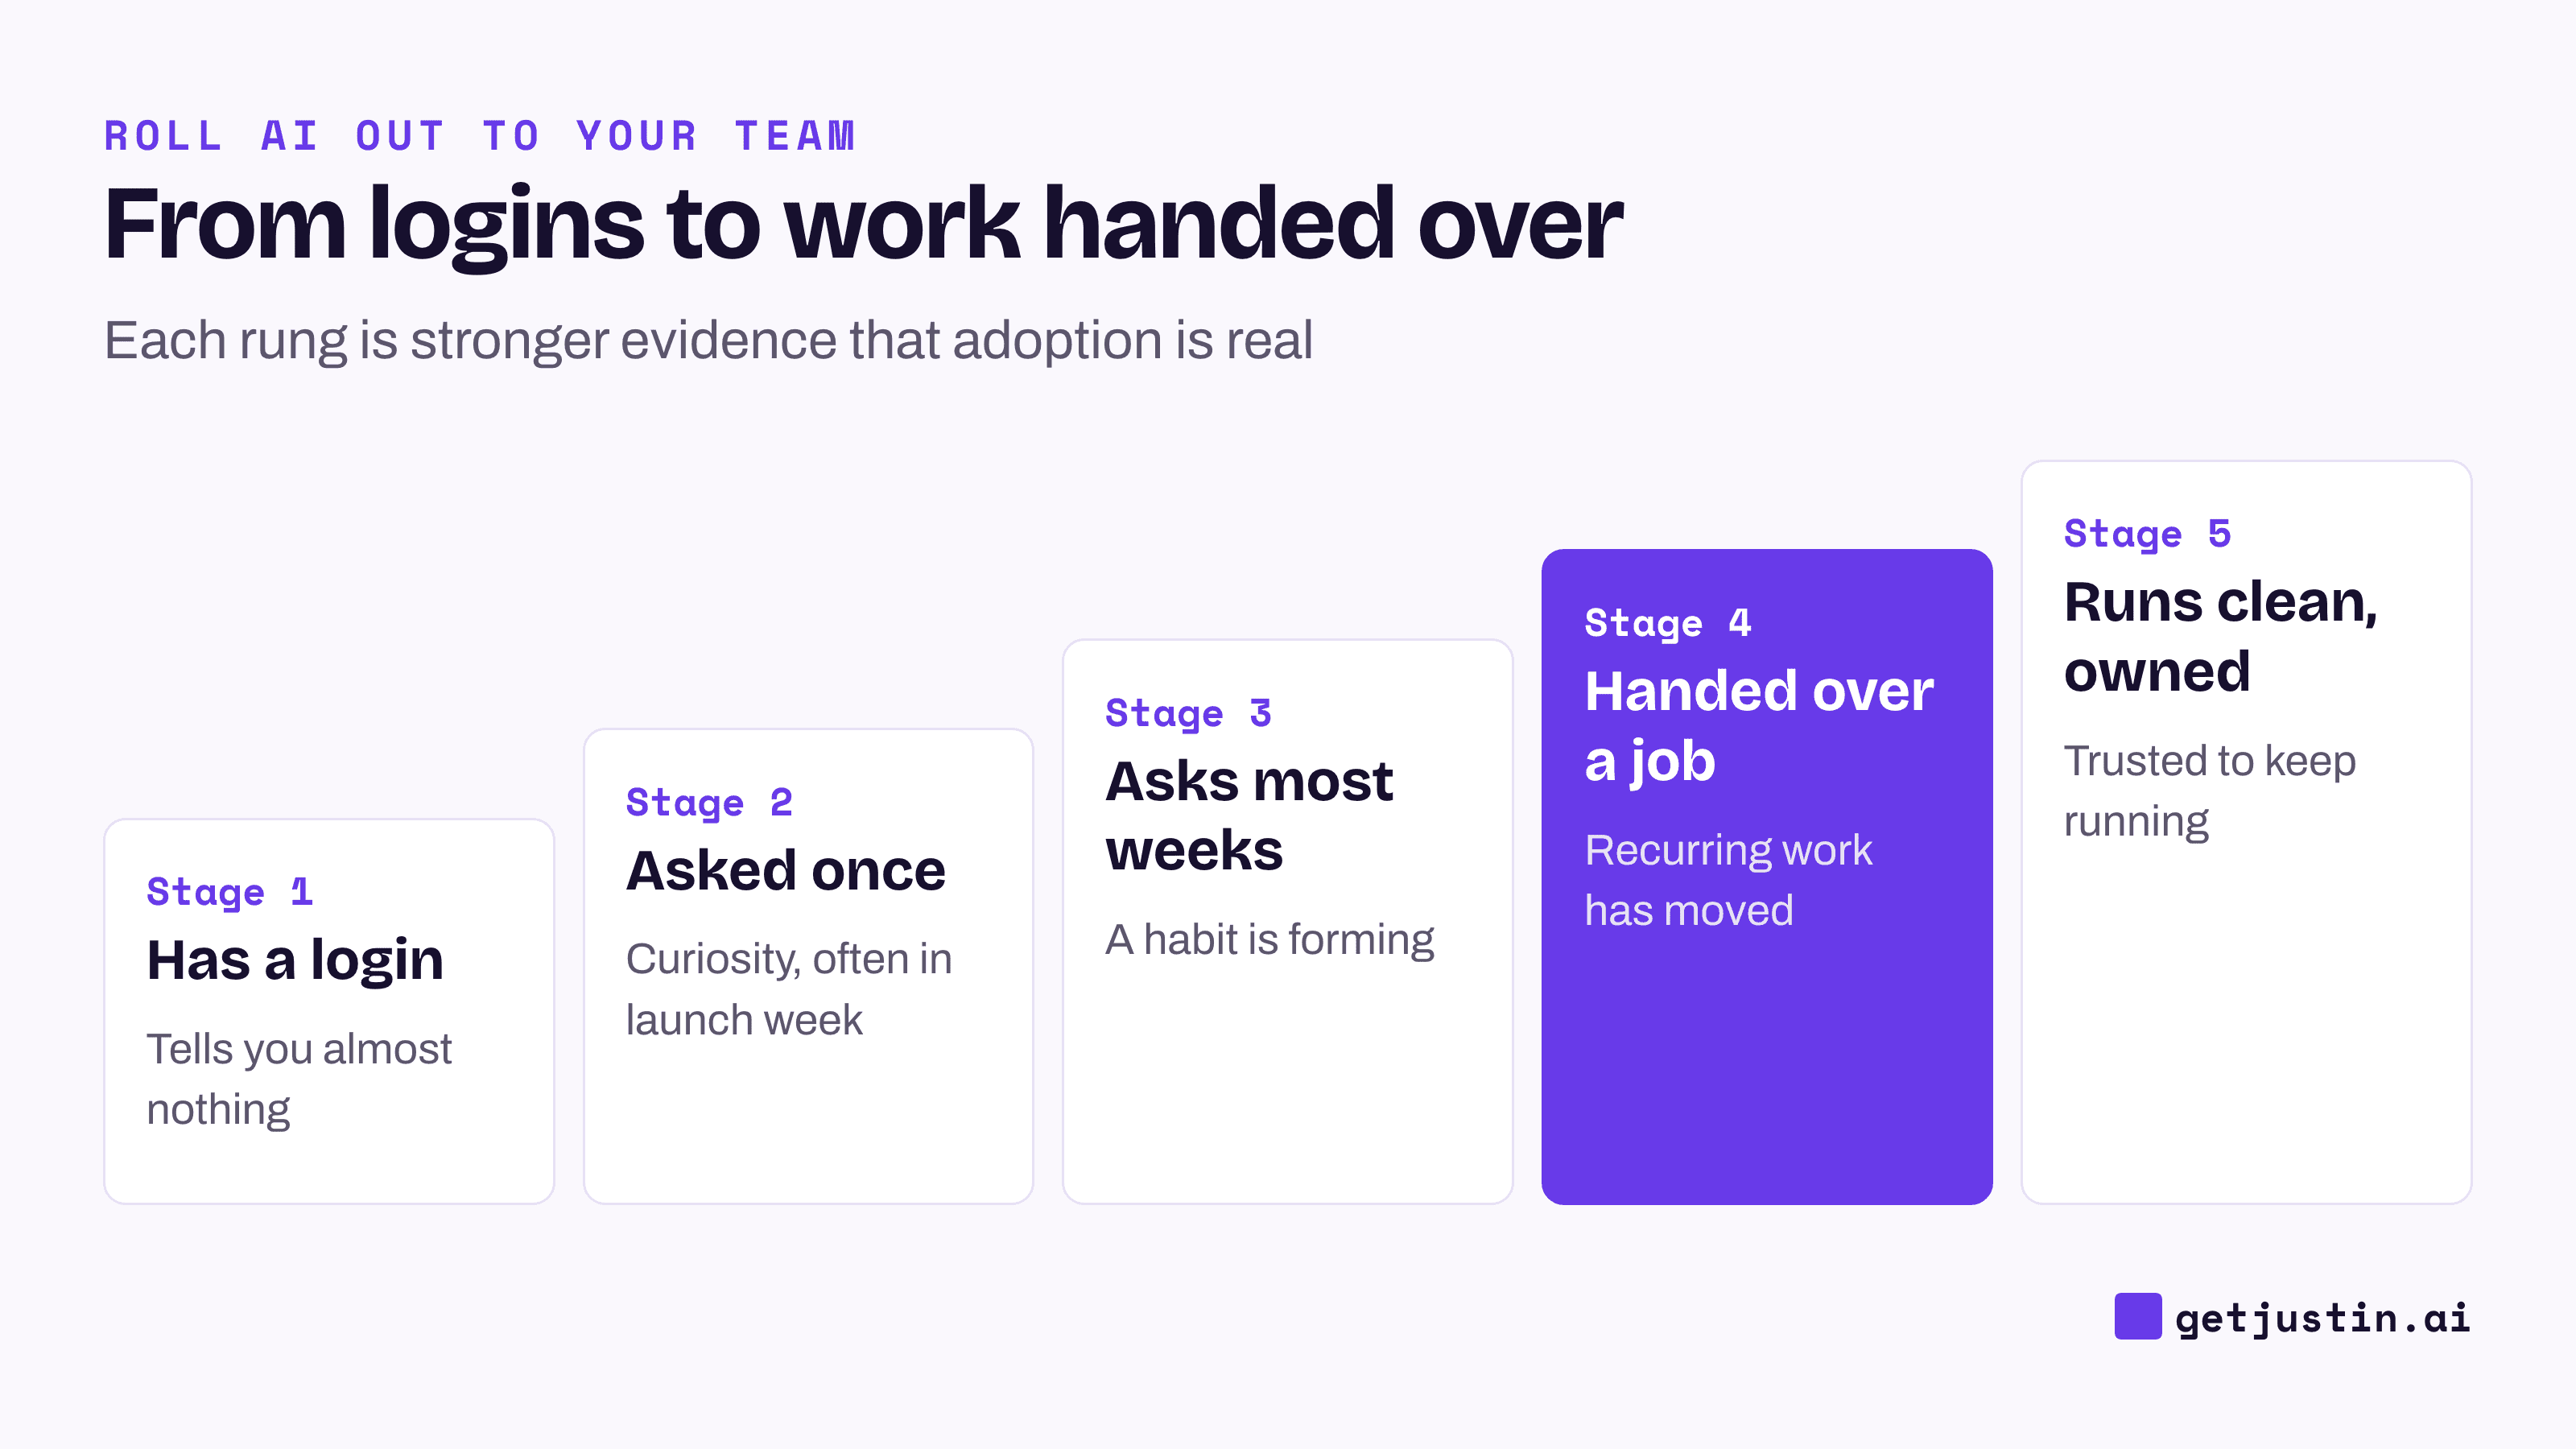
Figure: A login is the weakest signal; a recurring job that runs clean and has an owner is the strongest.
The 8 AI adoption metrics, with formulas
The eight metrics fall into three groups: who is asking (1 to 3), what work has moved (4 to 6), and whether the team trusts the AI coworker to keep running (7 and 8). Count each over a calendar month.
# | Metric | Formula | Where to find it | What it tells you |
|---|---|---|---|---|
1 | Active askers | People who asked it for anything ÷ people on the team | Channel search for mentions; count names | Reach |
2 | Repeat askers | Active askers who asked in 3 of the month’s 4 weeks ÷ active askers | Same search, by week | Habit, not novelty |
3 | Channels in use | Channels with 5 or more requests | Same search | Spread past the first team |
4 | Jobs handed over | Recurring jobs it did twice or more, with a named owner | Owners’ list, scheduled-job list | Work that moved |
5 | Output used as-is | Outputs used with light or no edits ÷ 10 sampled | Owner’s tally | Quality |
6 | Clean-run rate | Runs that arrived complete ÷ scheduled runs | Run history, plus one figure checked at source | Silent failures |
7 | Approval rate | Requests approved ÷ approval requests | Approval record | Whether its proposals make sense |
8 | Owner coverage | Recurring jobs with an owner and a backup ÷ recurring jobs | Owners’ list | What breaks when someone is away |
Watch repeat askers first: launch week always inflates active askers, and repeat askers shows who came back. If it falls two months running, read why employees stop using AI after trying it.
Clean-run rate exists because scheduled work fails quietly: on our team, 28% of 1,578 scheduled runs over eight weeks never got their data and still looked normal in the task list (the AI agent usage policy template covers the guardrails). So a run counts as clean only when its output arrived complete, not when its status says delivered.
For approval rate, read the declines, not the ratio: a cluster on one kind of action usually means that job’s instructions are wrong.
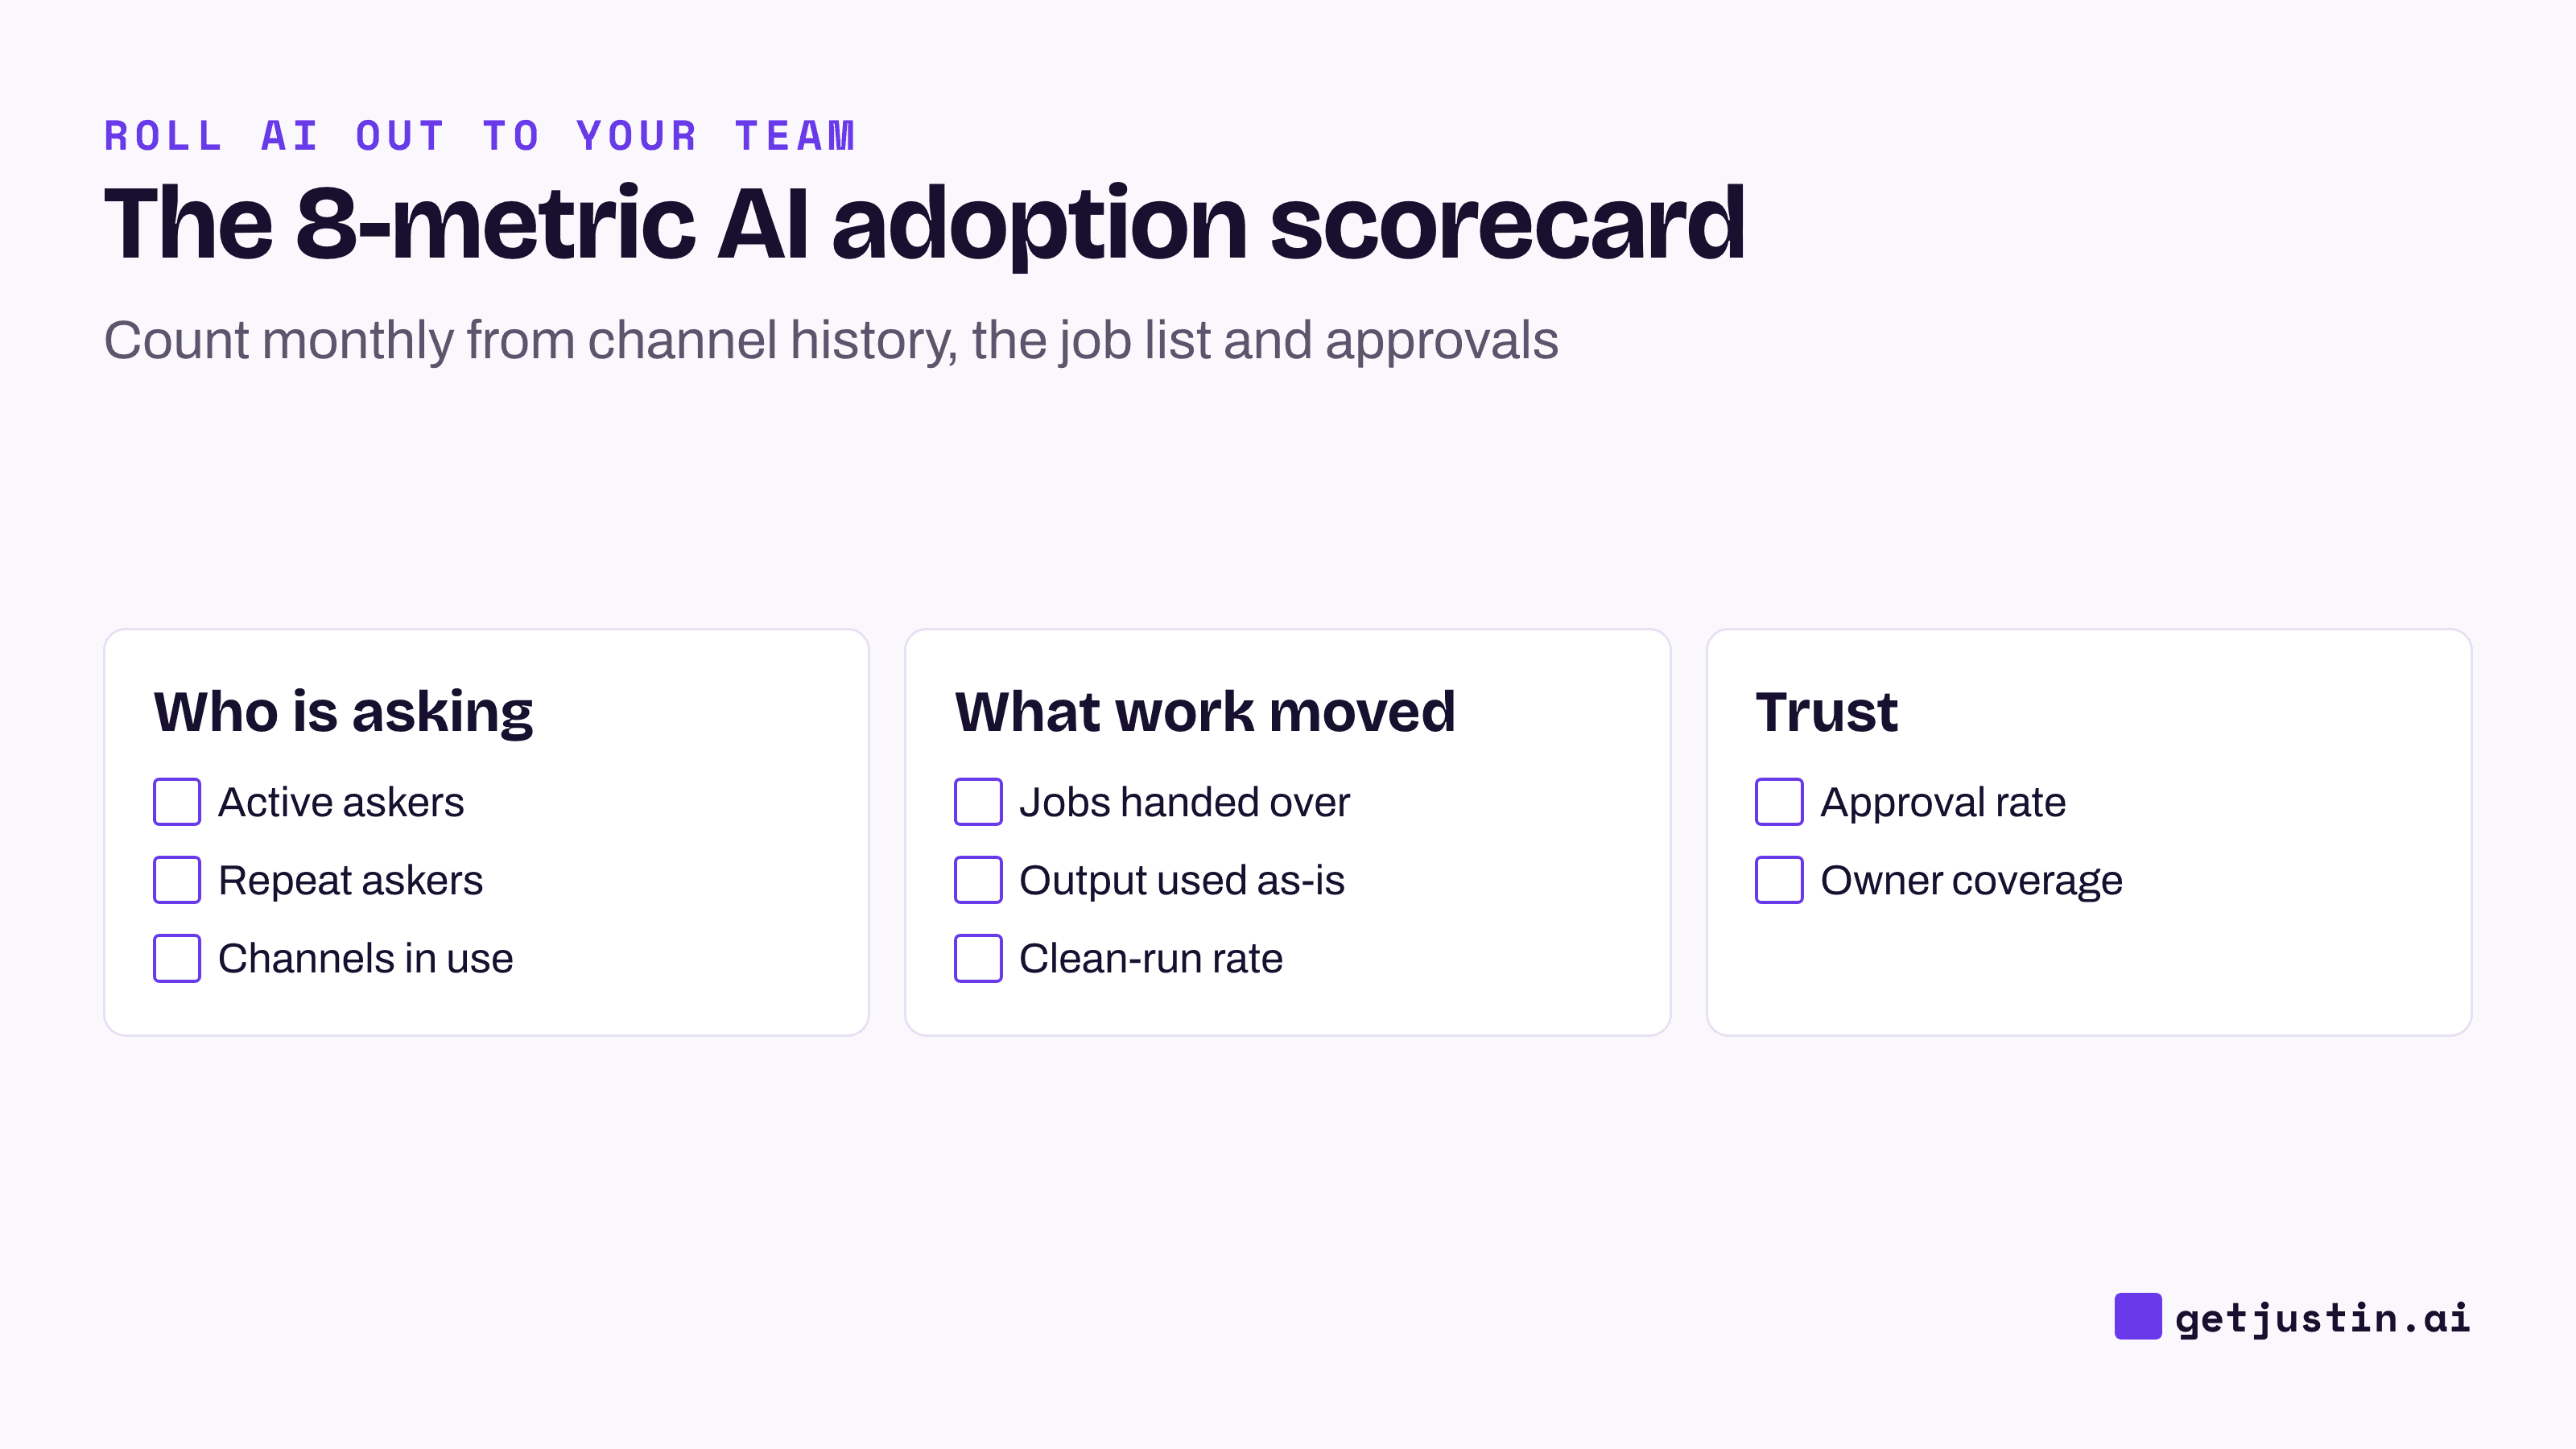
Figure: Eight metrics in three groups; copy them into a sheet with one column per month.
How to measure AI adoption without a telemetry tool
You can measure AI adoption from three records you already have: channel history, the scheduled-job list and the approval record. One person fills the sheet on the last working day of each month.
Count from the system’s records, never from memory or the AI’s own notes. When our CS ops lead built usage tracking for the team’s skills, a hook posted one row (time, skill, person) per run, rather than an instruction asking the AI to log itself. As the ops lead wrote in the setup notes, the model follows that kind of instruction “only about half the time.”
Write the gaps on the scorecard. Our tracking had a permanent blind spot, since the chat app had no hooks at all. Channel search misses direct messages the same way; a sheet that says “excludes DMs” beats one that pretends to be complete.
What we still don’t have is the signal we wanted most. When our first skill suite shipped, our CS ops lead wrote that the real test was which skills the same person re-invoked daily: “I’ll know in three weeks.” The clean read never came, and by August the ops lead had ruled usage tracking out of scope. That’s why this scorecard rests on records a person can count.
Worked example: a month-two scorecard
Example: Acme, a 12-person DTC brand, added an AI coworker to #growth and #cs in month one. Two months in, the sheet reads like this.
Metric | Month 1 | Month 2 | The read |
|---|---|---|---|
Active askers | 9 of 12 | 7 of 12 | Launch spike fading, as expected |
Repeat askers | 2 of 9 | 4 of 7 | A habit forming in a core group |
Channels in use | 2 | 3 | #ops started without being asked |
Jobs handed over | 1 | 3 | Weekly recap, ticket digest, UTM check |
Output used as-is | 4 of 10 | 7 of 10 | Corrections are sticking |
Clean-run rate | 4 of 4 | 7 of 8 | One recap arrived without Shopify data |
Approval rate | 5 of 6 | 9 of 14 | Declines cluster on CRM updates |
Owner coverage | 1 of 1 | 1 of 3 | Two new jobs have no backup |
The headline isn’t the drop in active askers. It’s the bottom three rows: jobs are growing faster than owners, one run failed quietly, and the CRM-update instructions need fixing before anyone approves that action in advance.
Targets, not benchmarks, and the monthly read
Published adoption benchmarks come from enterprise seat data, so set each target against your own month one, with the decision you’ll make if you miss it.
Example targets for month three:
Repeat askers: at least half of active askers. If missed, give the lapsed group one concrete job, not more training.
Clean-run rate: every scheduled run complete. If missed, pause that job until you know why.
Owner coverage: every recurring job has a backup. If missed, add no new jobs.
The monthly read is three questions, in order. Did recurring work move (metrics 4 and 5)? Is anything failing quietly (6 and 7)? Is use spreading without depending on one person (1, 2, 3 and 8)? If the first answer is no, the rest can wait.
Post the scorecard in the team channel with one sentence on what changes next. If a metric stalls twice, change the plan, not the target; the 30/60/90-day rollout plan sets out when to expand and when to stop.
FAQ
What are the most important AI adoption KPIs?
For a small team, the most important AI adoption KPIs are repeat askers, which shows whether people came back after the first week, and jobs handed over, which shows whether recurring work moved. Seats and logins show access, not adoption.
What is a good AI adoption rate for a small team?
No reliable benchmark exists for small teams, because published rates come from enterprise seat data. Set targets against your own first month instead, such as repeat askers rising month over month.
Should we track time saved by AI?
Only if you timed the task before the AI coworker took it over. Self-reported hours saved are guesses, and they tend to flatter the tool. Jobs handed over and output used as-is are easier to verify and point at the same thing.
Who should own the AI adoption scorecard?
One person who can read channel history and the scheduled-job list: often the owner of the first job, or the team’s AI champion. Post the result where the whole team can see it.
Doing this with Justin
Justin, the AI coworker for Slack, keeps most of the records this scorecard reads. Its automations are listed at app.getjustin.ai/automations, and when you choose an automation’s destinations, a run is marked failed if any of them fails, so a missed delivery shows up. It asks before it writes to your connected tools, and those requests sit in the same channel history you search for the other counts. Keep the monthly counts in a connected Google Sheet and ask Justin to turn it into a live page: it shows when its data was last updated, you can ask where any number came from, and the link stays the same when you ask for changes. Then ask for an automation that reminds the owner at the end of each month. There are no seats to count; every plan covers the whole team.