

Short answer: A marketing dashboard in Slack arrives one of three ways: a screenshot or PDF of a BI report, a link into the BI tool, or a live page that re-reads its sources whenever someone opens it. Screenshots go stale once posted and BI links often go unopened, so for the numbers a team checks every week, a live page linked in the thread is usually the better choice. Keep the BI tool for drill-down and company-wide definitions.
What matters is less how the dashboard looks than whether the number is current when someone reads it, and whether anyone reads it at all.
What are the three ways to put a dashboard in Slack?
The three ways to share dashboards in Slack differ in where the numbers live after you post. A snapshot is a picture of the dashboard at one moment: a screenshot, or a scheduled PDF or image from the BI tool. A BI link points back into the tool, so the numbers are current but sit behind a login. A live page is a page built from the connected sources and linked in the thread; it reads them again each time it opens.
Snapshot (screenshot or PDF) | BI link | Live page | |
|---|---|---|---|
Current when opened | No, frozen at posting | Yes | Yes, re-read on open |
Opens on a phone from the thread | Yes | Usually after a login | Usually; may ask you to sign in |
Shows each figure’s source and read time | No | Partly, if the builder added it | Yes, if you ask for it |
Changed by | Posting a new one | Editing in the BI tool | Asking in the thread |
Drill-down and filters | No | Yes | Limited |
Company-wide governed definitions | Inherits the BI tool’s | Yes | Per page, so check them |
The tools already support snapshots well. The Tableau app for Slack can share a view with a snapshot preview that everyone in the channel sees, whatever their Tableau access (Tableau Help, accessed 2026). Google’s documentation, which now calls Looker Studio “Data Studio”, lists scheduled Slack delivery of a PDF and a link as a Pro feature (Google Cloud docs, accessed 2026). The diagram below sums up the trade.
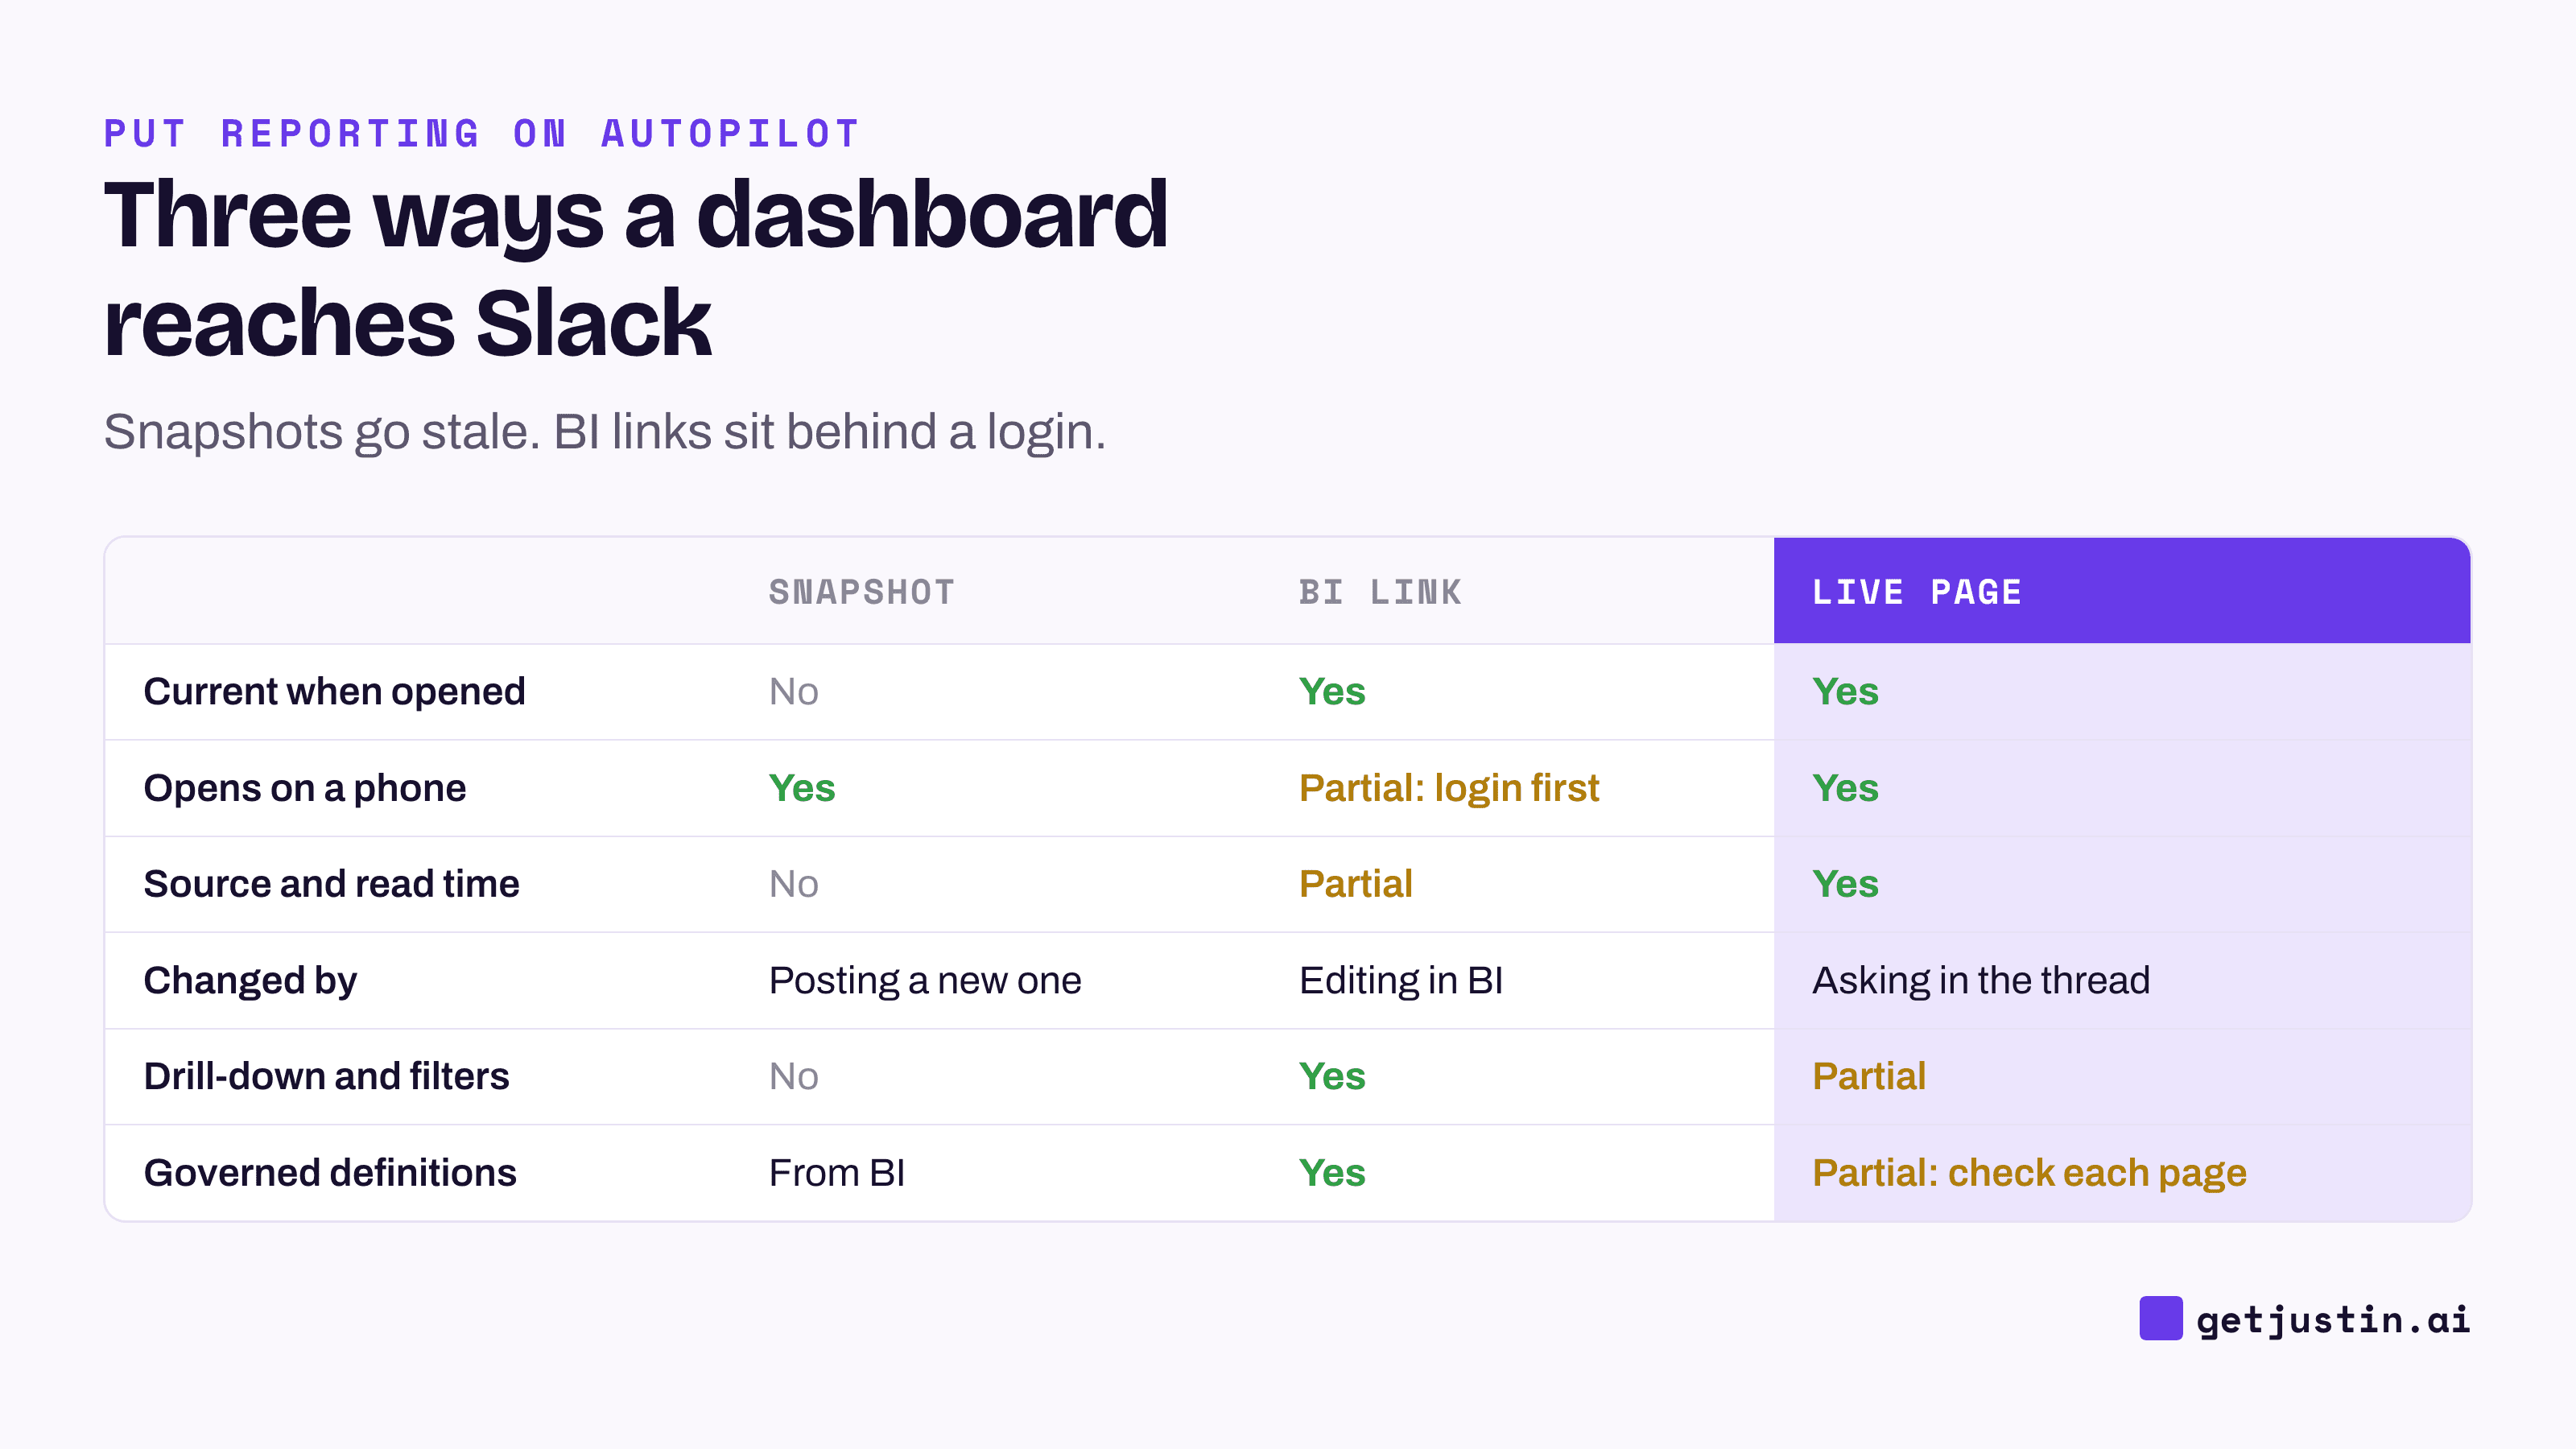
Figure: A snapshot is easy to read and wrong by next week; a BI link is right and rarely opened.
Why do screenshots and BI links fail in a channel?
Screenshots fail because they keep circulating after they stop being true. A chart posted on Tuesday gets forwarded the next Monday with nothing to say it’s a week old. It carries no source either, so when it disagrees with Ads Manager, nobody can say which to believe.
BI links fail the other way: the numbers are right, but few people go get them. Researchers who ran co-design sessions with enterprise data workers found that analysts routinely rework dashboard content for colleagues who engage with it little (Kim, Srinivasan and Brehmer, 2023). A link behind a login, on a phone, to a dashboard with twelve filters, is a lot to ask.
We’ve seen the second failure first-hand. On our CS team, leadership asked for a per-team commercial scorecard to be added to our biweekly report. The first dashboard already covered much of what they asked for; it had been demoed, and it went unused. Our CS ops lead’s position then: “the dashboard is the forward-looking scoreboard, this report is the … attention/accountability layer it can’t show.” The gap wasn’t missing numbers. It was that nobody went to where the numbers lived.
When is a BI tool still the right place?
A BI tool is still the right place when the work is exploration rather than checking. Cutting revenue by cohort, region and product in one sitting, joining two years of history, or applying row-level security so each agency sees only its own clients are all BI jobs. So are definitions finance also reports on, like net revenue, where one governed formula matters more than convenience.
The practical split for a small team: BI stays the system of record for definitions and deep analysis; Slack gets the handful of numbers people check every week. Put a link to the BI drill-down at the bottom of the live page.
How do you build a live page for your marketing dashboard?
You build a live page by asking for it in the thread where the numbers are discussed, then checking it before anyone relies on it. Start from the five or so numbers your weekly marketing report already carries, not from everything the BI tool can show.
Then make the page prove itself. Each figure should name its tool, the metric as that tool names it, the date range and when it was read; pulling GA4, Shopify and Meta into one thread covers why. Compare two figures against the platform’s own screen before you share the link. The checklist below is what we’d require of any live page before it goes in a channel.
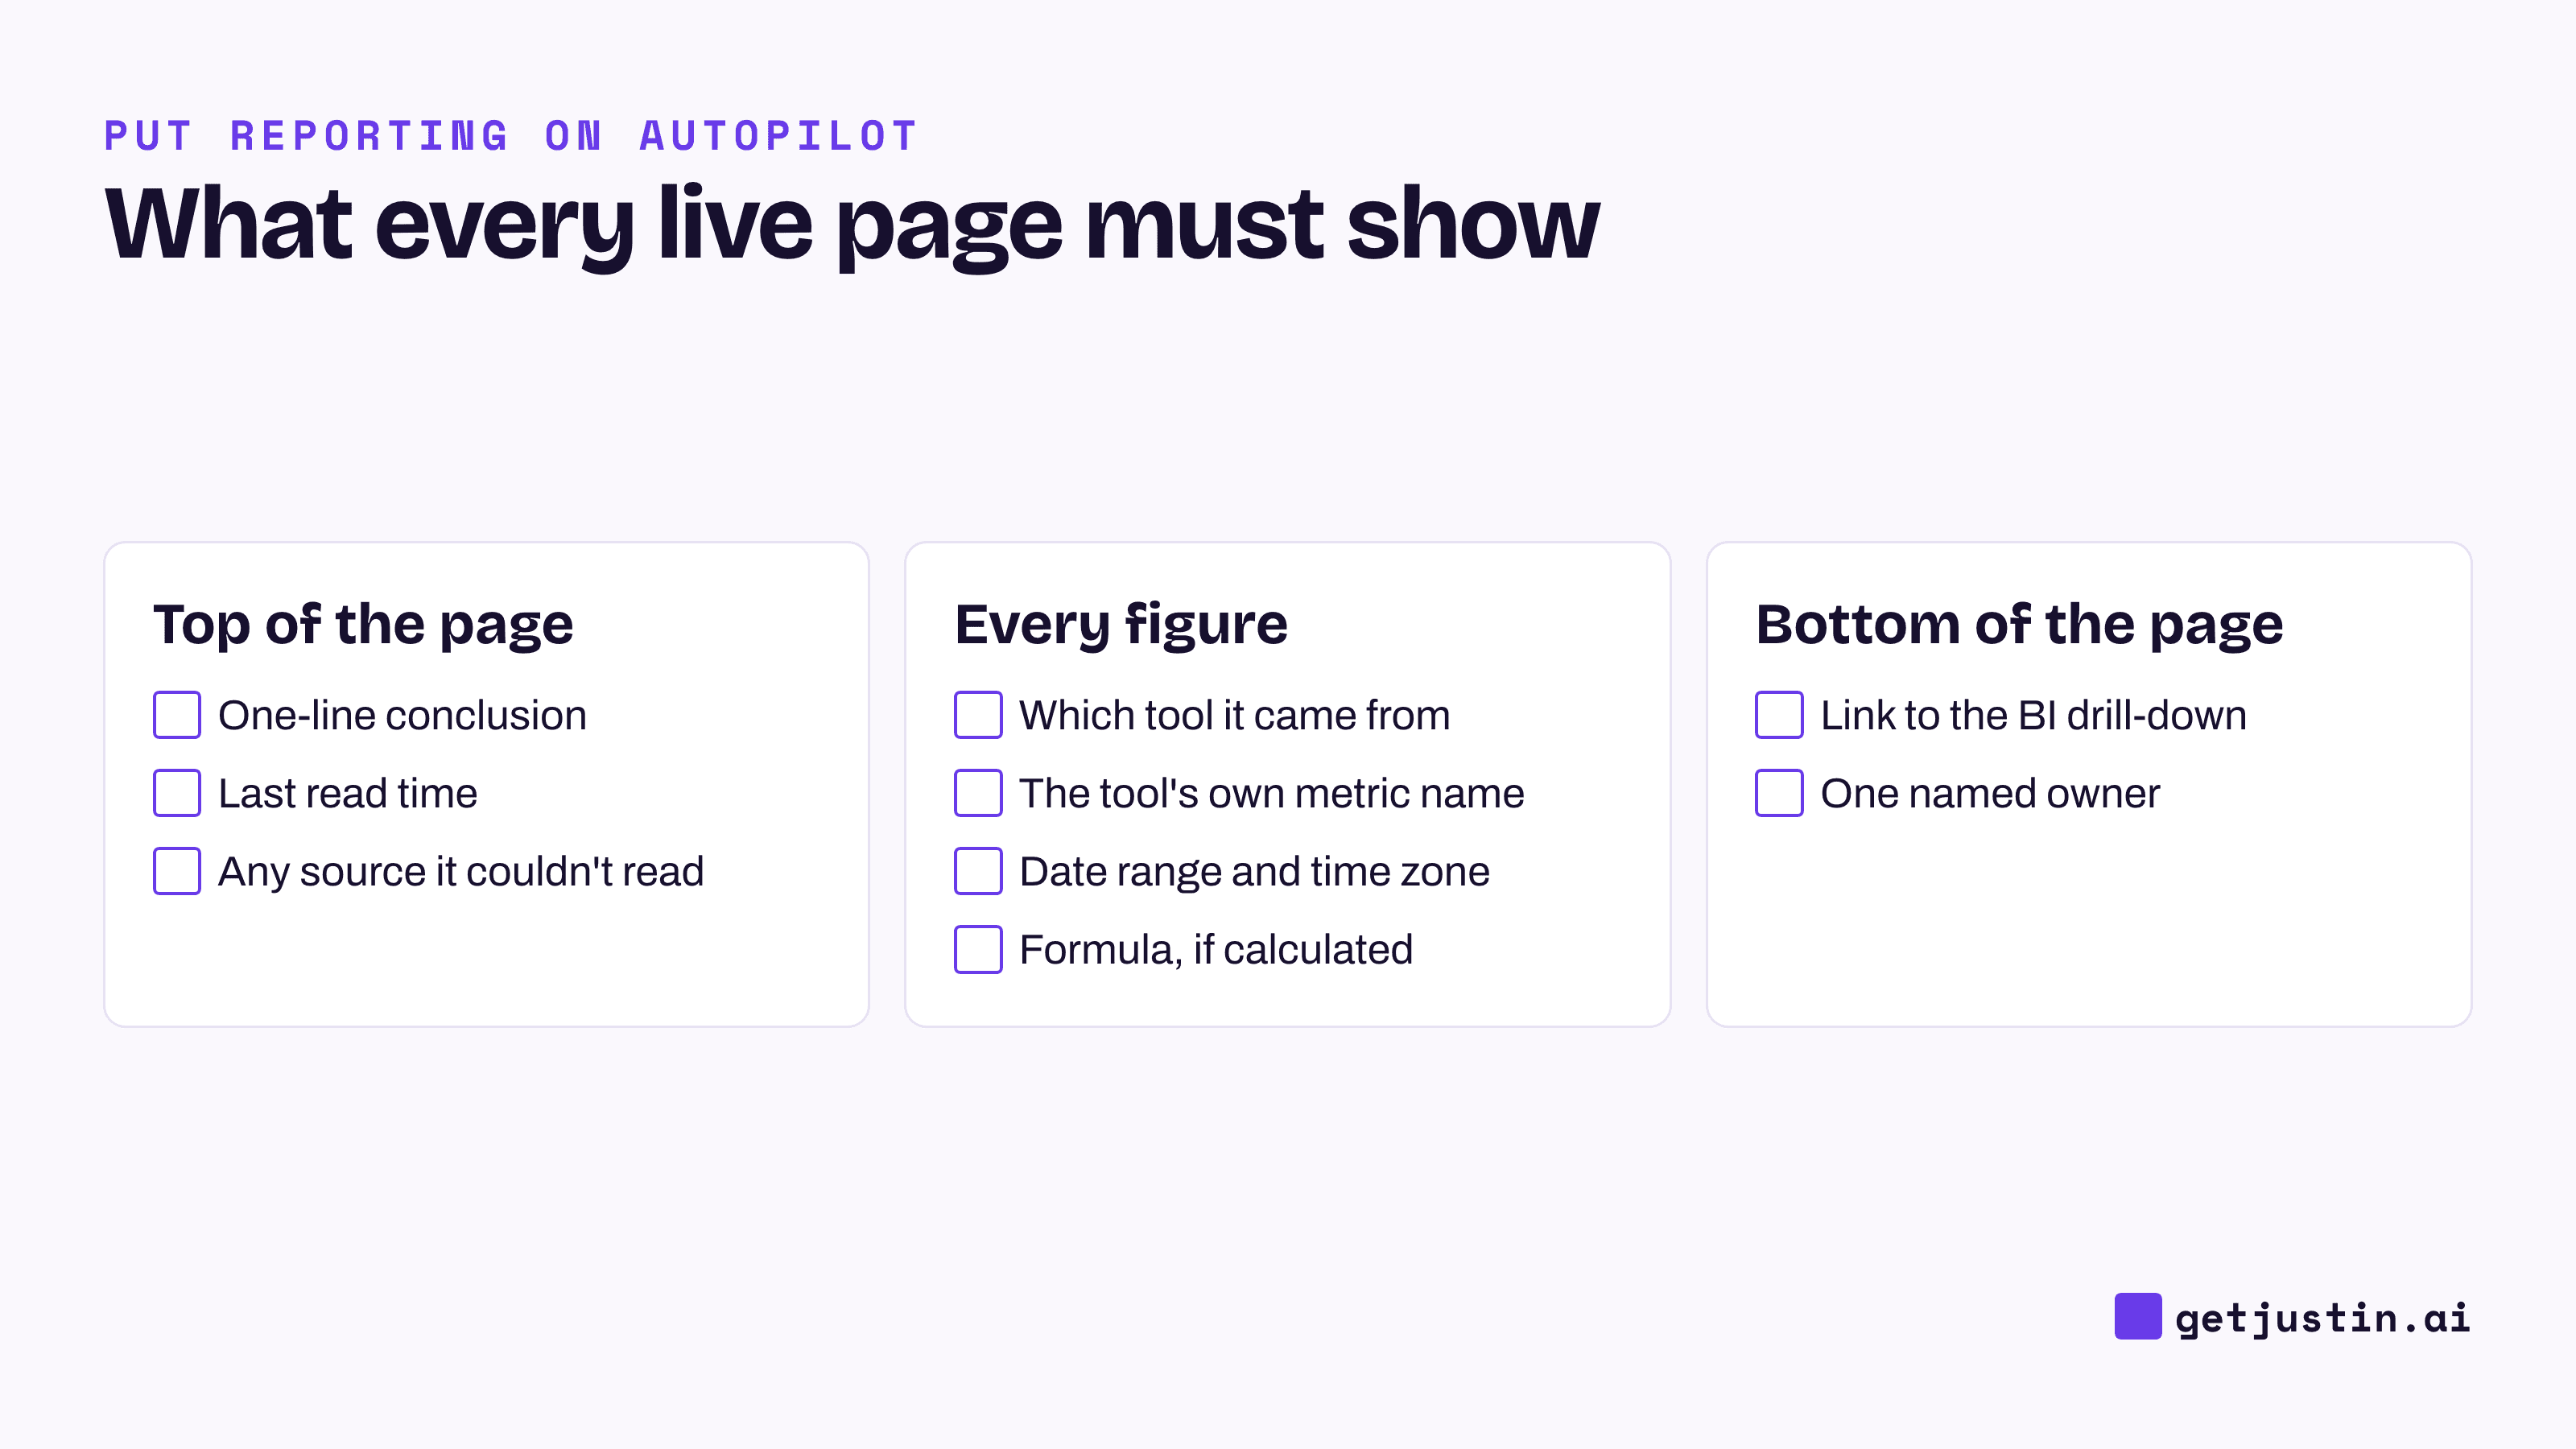
Figure: Without these labels, a live page is just a prettier screenshot.
How do you keep a Slack dashboard current?
A Slack dashboard stays current in two different ways, and only one is automatic. The numbers refresh each time the page opens. The definitions don’t: a renamed campaign, a new ad account or a changed target will leave the page showing the wrong thing, confidently. Give the page one owner and review it monthly.
Change it in place, by asking in the thread, so the link stays the same. If every edit makes a new link, the old ones keep circulating, and you’ve rebuilt the screenshot problem. When a source can’t be read, the page should say so at the top instead of quietly showing the last numbers it had.
A live page waits to be opened, so it can’t interrupt anyone. Pair it with a Monday post that links it, and with anomaly alerts for marketing metrics for anything that can’t wait a week.
FAQ
How do I share a dashboard in Slack?
Post a screenshot or scheduled PDF, paste a link into your BI tool, or share a live page built from your connected tools. For numbers checked weekly, a live page that re-reads its sources on open avoids stale screenshots.
Can Looker Studio post a dashboard to Slack automatically?
As of September 2026, Google’s documentation calls the product Data Studio and lists scheduled Slack delivery as a Pro feature: a message with a PDF and a link. The standard plan emails a PDF on a schedule. Either way, what arrives is a snapshot.
Can Slack build a marketing dashboard itself?
Slack first shipped Surfaces on July 29, 2026 (Slack) and relaunched them as Slackforce Surfaces on September 11, 2026: Slackbot builds dashboards and reports from a request. As of September 24, 2026, Slack still marks auto-updating live data as coming soon (Slack). The Slackforce Surfaces alternatives compare other ways to get a live dashboard in Slack.
Is a live page safe for revenue numbers?
Keep it visible to your team only by default, and share outside the team only on purpose. Check who can open the link before you post it in a channel with guests. Treat a public link to revenue like forwarding the spreadsheet.
How often should a marketing dashboard in Slack refresh?
Refreshing on open is enough for weekly numbers. Hourly checks only matter for fast-moving spend, like a launch week, and those are better as alerts that speak up when spend drifts.
Doing this with Justin
Justin, the AI coworker for Slack, builds live pages from the tools you connect, such as Google Analytics, Shopify and HubSpot. Invite it to #marketing, @-mention it with the five numbers you want, and it links the page at the end of its reply. Live pages show when their data was last updated, and you can ask where any number came from; the numbers refresh when you open the page again. To change it, ask in the channel; the link stays the same, so nobody re-shares it. A public link is available when you mean to share outside the team. To keep it in front of people, ask Justin to post the link on a schedule, every Monday at 9am, naming your time zone, and reply under it for follow-ups.