

Short answer: Competitor growth analysis works backwards. First confirm the brand is growing and roughly when it started, then check what changed just before that date: ads, search pages, pricing, product, distribution and press. An AI coworker can gather and date the evidence at scale, but you decide which explanation the evidence supports, and everything else goes under “unknown.”
Most advice on why a competitor is growing lists plausible reasons: sharper positioning, a better website, more visibility. Those are guesses. How to analyze competitor growth properly comes down to one habit: every piece of evidence carries a date.
Is the competitor actually growing?
Confirm the growth with at least two independent signals before you try to explain it. A single chart from a traffic tool is not proof, and neither is a founder’s post about a record month.
Good signals are public and dated. Branded search interest in Google Trends is a sampled index from 0 to 100, not a search count, so read its shape, not its level. Review counts per month on Amazon, G2 or app stores are a demand signal, since reviews loosely track orders. Job posts, new retail listings and follower counts add a third angle.
Traffic and revenue figures from third-party tools are estimates. Compare a competitor’s trend inside one tool, and never compare one tool’s number with another’s. On our CS team, we once computed cost-to-acquire the obvious way, and our figure and the dashboard’s were about ten times apart. Both were arithmetically correct. One covered a single storefront and the other summed them all, so they weren’t the same metric, and tools labelled “visits” differ in the same way.
Competitor growth analysis: date it, then explain it
The month the growth started is the most useful fact you can find, because the cause usually changed just before it. The diagram below shows the order: confirm, date, list causes, match evidence to dates, then make the call.
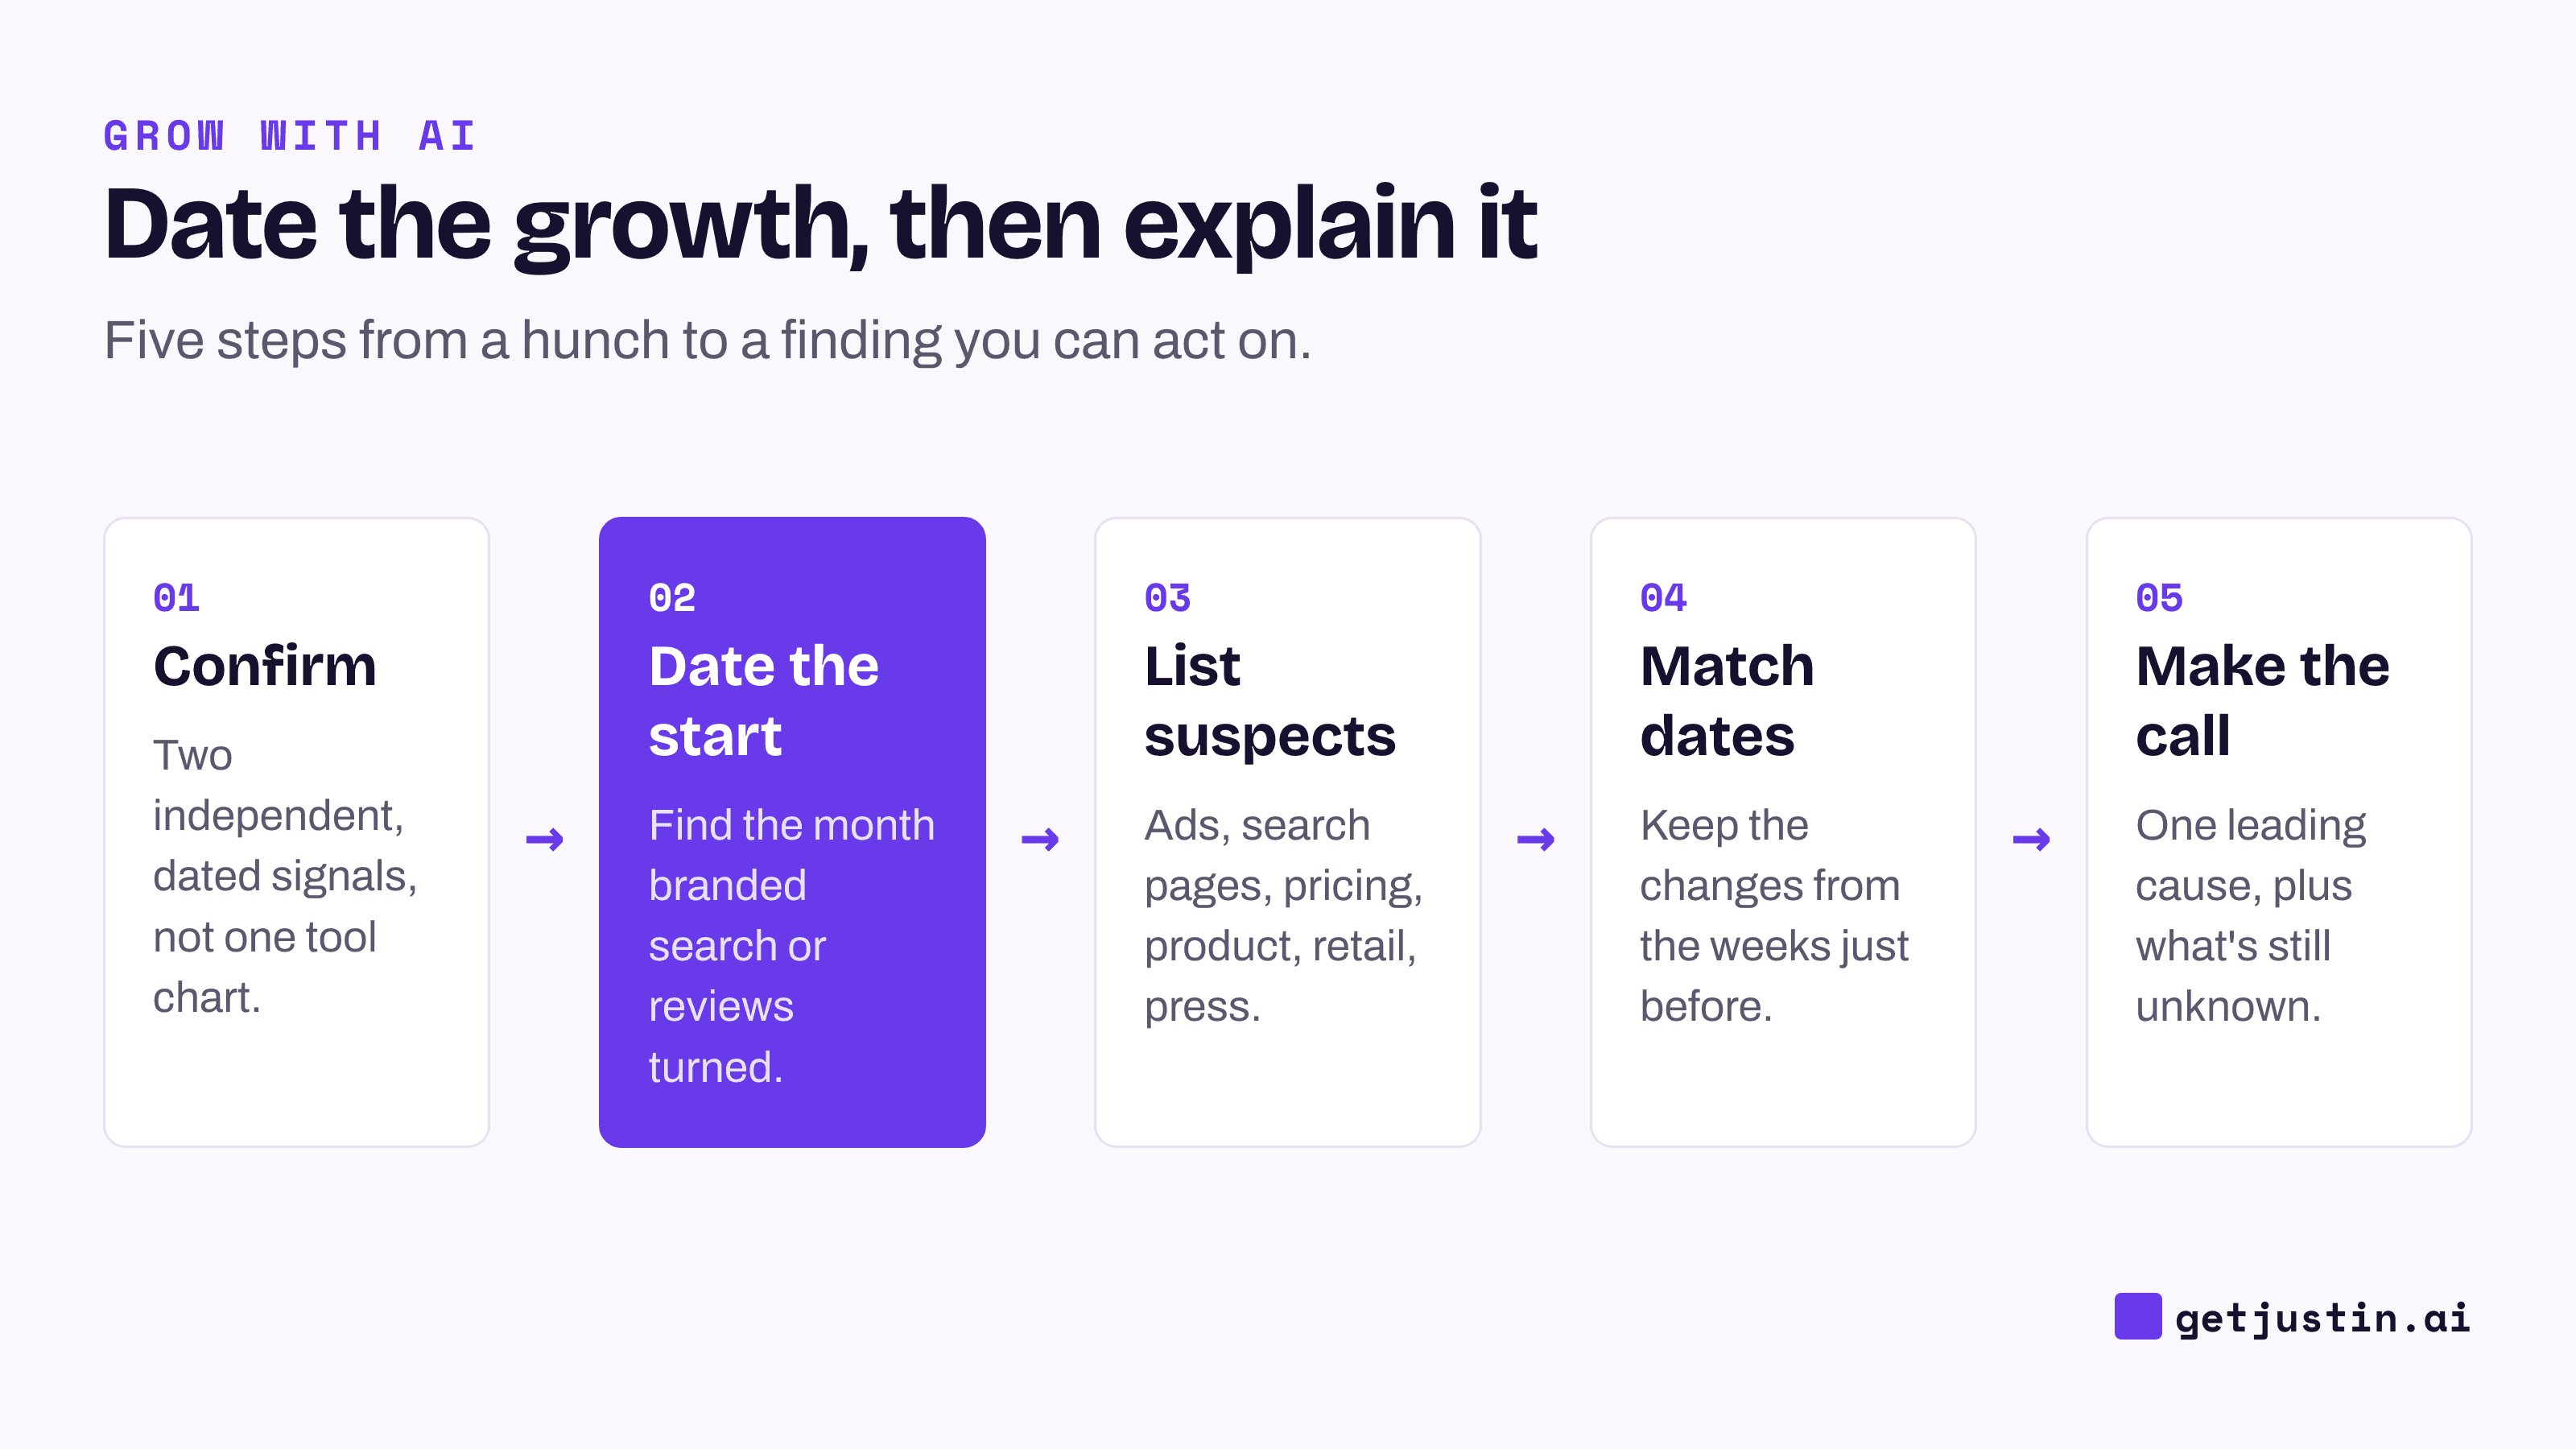
Figure: Dating the start of the growth turns a list of guesses into a short list of suspects.
Ask the AI for a timeline before an explanation. A prompt that works:
List every dated change you can find for Rival B from January to June: ads, pricing, product, retail, press, hiring. One row per change with the date, what changed and the source link. Don’t explain the growth yet.
Then lay the rows over the branded-search curve. Changes after the curve turned are effects or coincidences. Changes in the weeks just before it are your suspects.
What changed just before? Where to look
Each candidate cause leaves a different public trace, and each trace has a limit. The table below is the checklist to hand your AI coworker.
Candidate cause | Where to look | Dated evidence looks like | What it can’t prove |
|---|---|---|---|
Paid ads | New ad sets and their start dates | Spend or results | |
Search pages | Sitemap, site search, archived snapshots | New page types: comparisons, integrations, locations | Which pages bring traffic |
Pricing or offer | Archived snapshots of the pricing page | A new plan, bundle, trial or price cut | Whether it’s profitable |
Product | Changelog, app store version history, launch posts | A launch that customers mention in reviews | Adoption |
Distribution | Retailer sites, store locators, marketplaces | A new retail partner or marketplace listing | Sell-through |
Creators and press | Press pages, podcasts, creator posts | A spike of mentions in one week | Paid versus earned |
Funding and hiring | Press releases, job posts | A round, then a wave of marketing hires | Timing of the spend |
Two causes get missed most. The first is distribution. Our CS team’s kickoff checklist asks whether a brand also sells through retail, a check that came from studying accounts we lost. Online data can’t see growth that happens in stores, so a DTC competitor that looks flat online may be growing on shelves.
The second is page types. Before we planned our own content, we had our AI coworker count pages by type across a sample of competitor sites instead of reading them. In that sample, one site had 163 blog posts, 11 case studies and 8 comparison pages, and two others had well over a thousand integration pages each. Much of their search footprint sits in page types a blog calendar never produces, a very different project to copy, so we parked it for later. The counting method is in competitor research with AI, and competitor ad research covers the ad row in detail.
How strong is the evidence?
Not every finding deserves the same weight, so grade each one before you act on it. The ladder below runs from weakest to strongest.
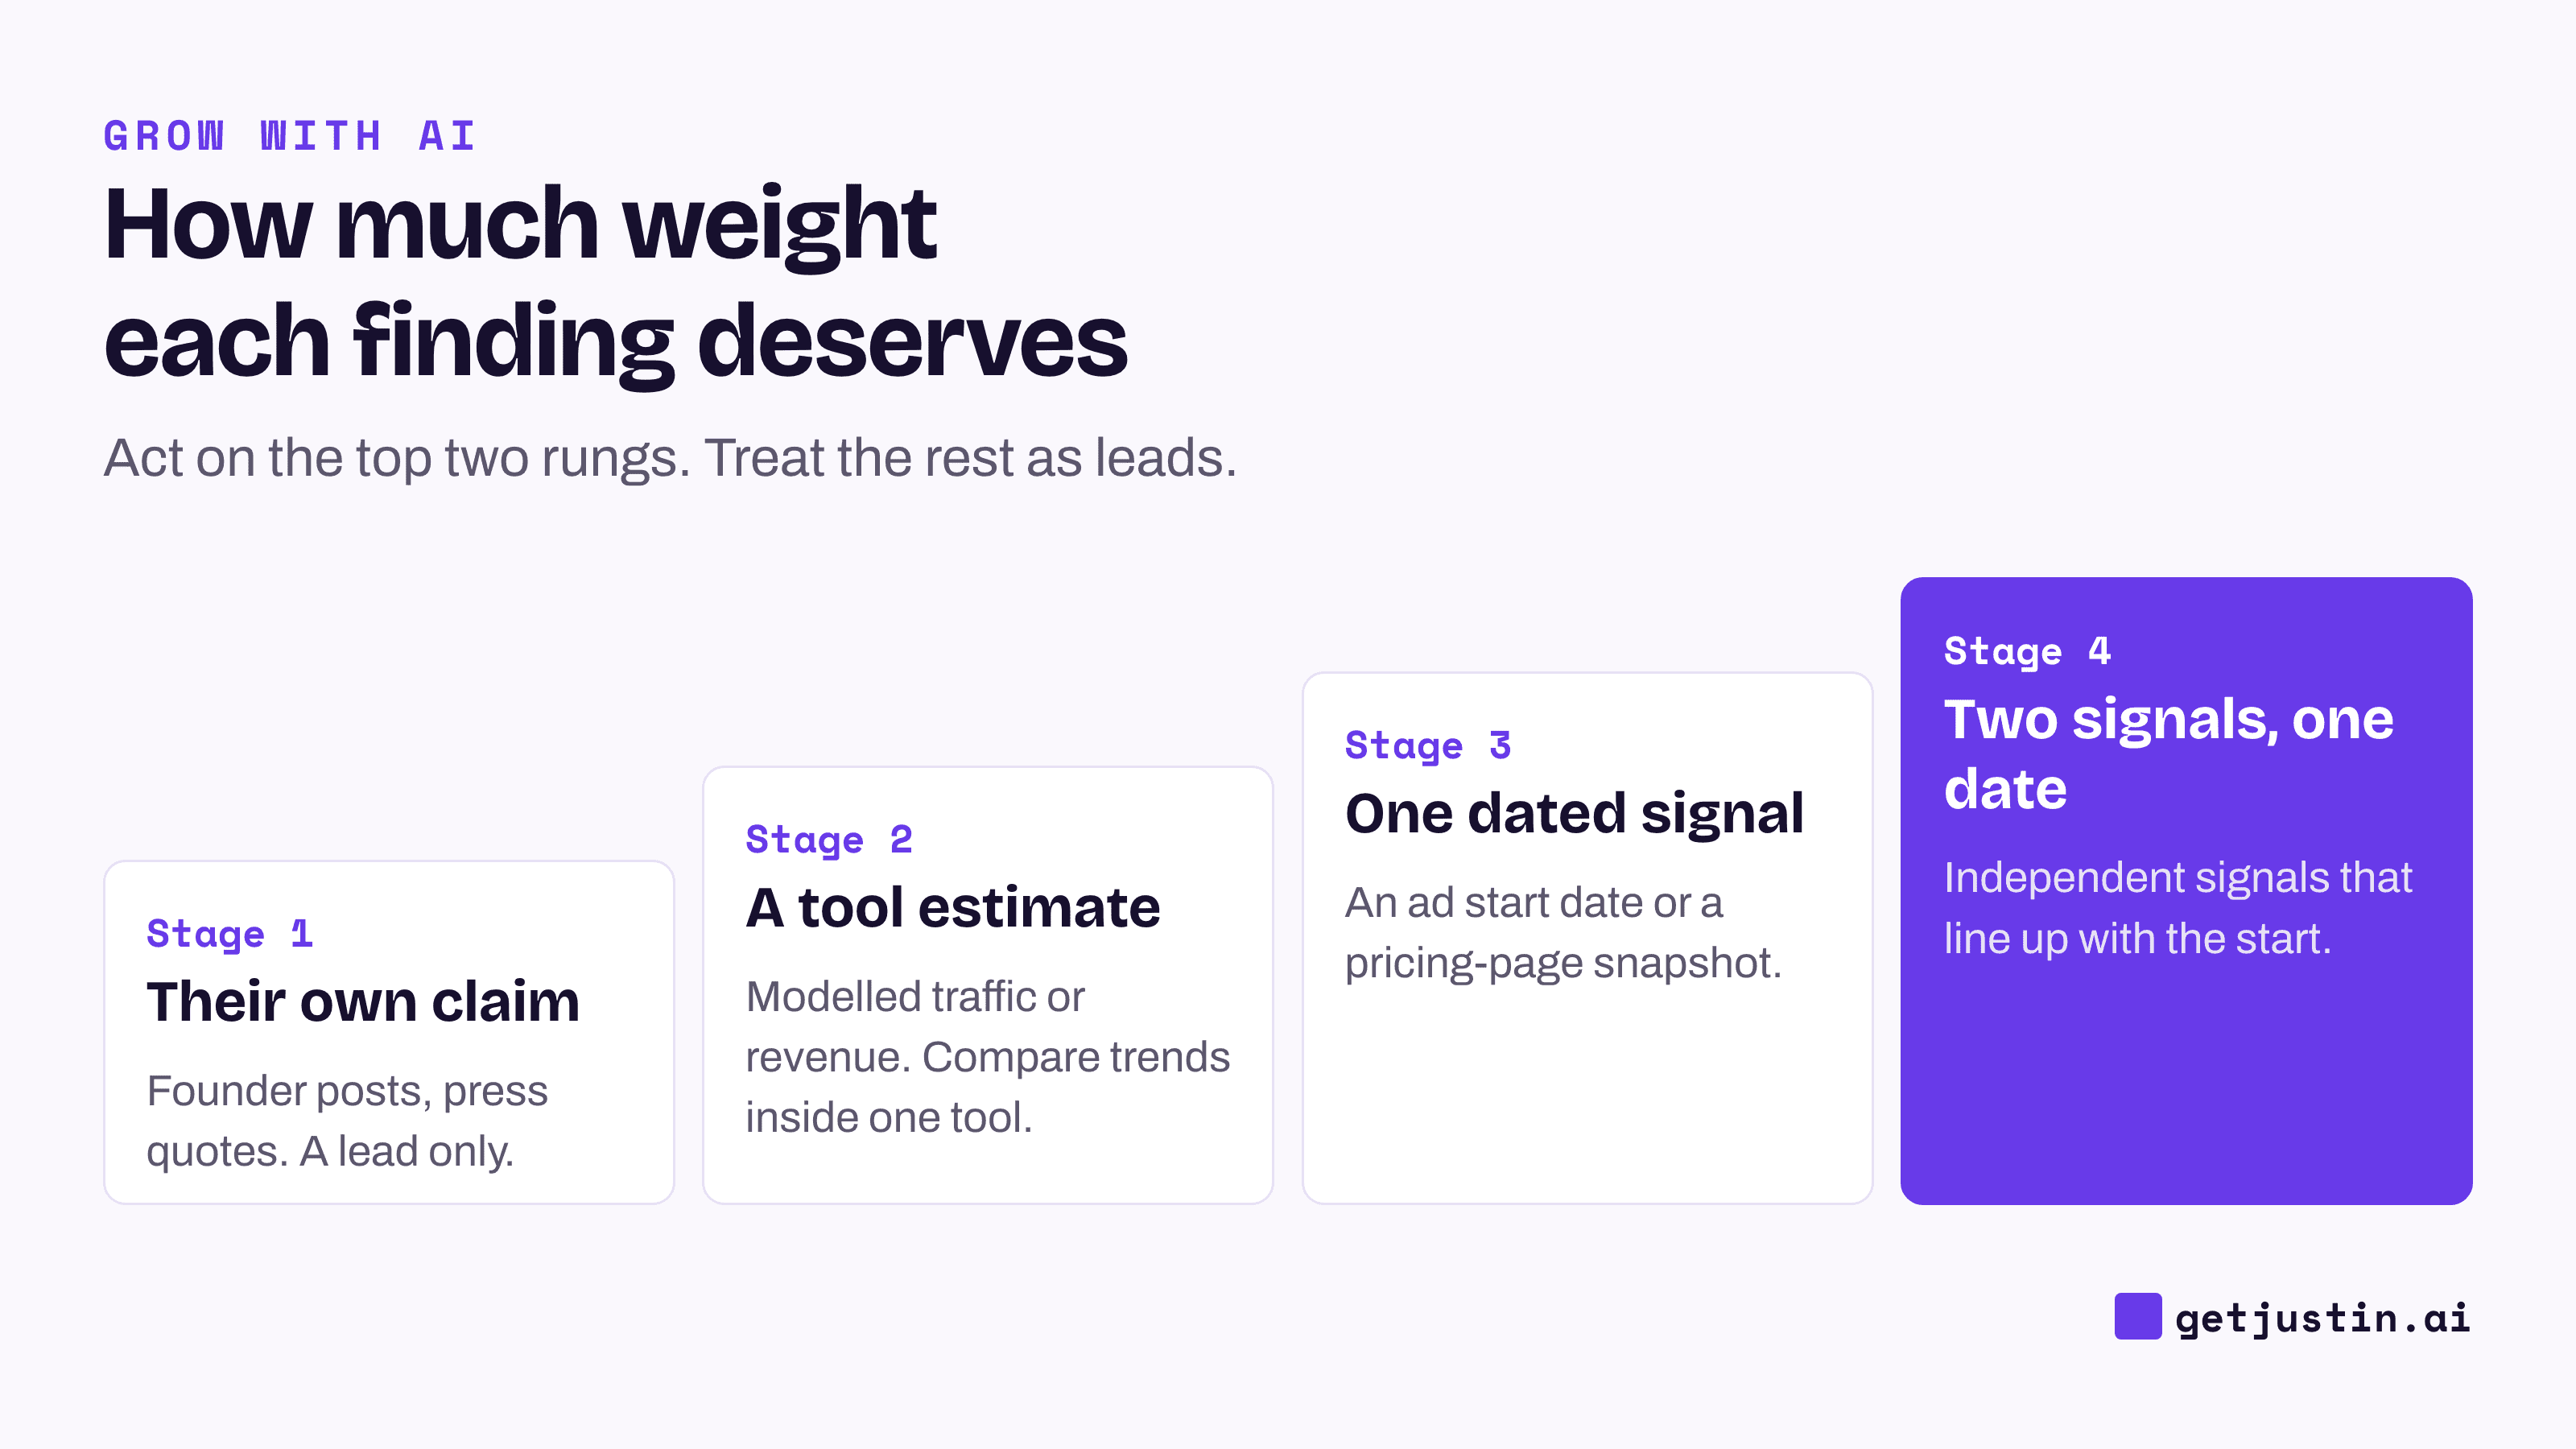
Figure: Act only on the top two rungs; everything lower is a lead to check.
A worked example shows the difference. Example: Rival B’s branded searches roughly double from March. Its ad library shows a bundle ad set that started in late February, and a February snapshot of its pricing page shows a new starter bundle. Reviews from April onward mention the bundle by name. Press and hiring show nothing. The bundle is the leading explanation, and the brief says so. It also says what’s unknown: whether the bundle makes money, and whether a retail deal nobody announced played a part.
Keep the AI in the evidence-gathering seat. Ask it to list what would disprove each explanation, and to label every number that came from an estimate. AI customer review analysis covers how to count review themes without one loud reviewer skewing them.
FAQ
Why is my competitor growing faster than me?
Usually because of one or two changes you can date: a new offer, a new channel, a retail deal or a burst of press. Find the month their growth started, then list what changed in the weeks before it. Generic reasons like “better branding” rarely survive that test.
Can you see a competitor’s revenue?
For a public company, yes: read its filings and earnings calls. For a private company, mostly no. Treat headcount, review velocity and branded search as rough proxies, and label any revenue figure from a third-party tool as an estimate.
Are Similarweb and Semrush traffic numbers accurate?
They are modelled estimates, useful for trends and rough comparisons. Compare competitors inside one tool, and never set one tool’s figure against another’s, because each defines and models traffic differently.
What free tools help with competitor growth analysis?
Google Trends for branded search, Meta’s Ad Library and Google’s Ads Transparency Center for ads, archived page snapshots for pricing history, review sites for demand, and job boards for hiring. Together they cover most of the table above at no cost.
Doing this with Justin
Justin, the AI coworker for Slack, can build the timeline in your team’s channel. Invite it to #growth, @-mention it with the rival’s name and the months you care about, and point it at the rival’s pricing page and its archived snapshots, changelog and press page; it reads each one, and you can ask it to link its sources. Share a Google Trends export and ad library screenshots as files. Ask for one table sorted by date, with a source on every row. Then ask for the brief as a live page. A live page shows when its data was last updated, and you can ask Justin to label where each number comes from. To keep watching, ask for an automation that rereads those pages on the first Monday of each month and posts only changes. Justin uses large language models; its output can be wrong or incomplete — check anything consequential before you act on it.
Related reading
See every ad your competitors are running (and what it tells you)
Anomaly alerts for marketing metrics: catch the drop before Monday